JakeyB789
Reserve Grader
Thought this deserved a share - very insightful piece into where things are currently going wrong for us by the guys over on The Rugby League Eye Test
 www.rugbyleagueeyetest.com
There’s plenty of interesting match ups leading into Magic Round after the conclusion of NRL Round 10.
There’s the Sharks holding on to first place and facing the hottest team in the competition Saturday evening. Canberra and Canterbury kick things off in the battle of two of the big overachievers. The Warriors woes continue against Penrith on Sunday afternoon, looking broken and tired and desperately needing a week off. The Cowboys will face the only team in the competition that’s worse than them defensively.
But this week I’m most interested in the Manly and Brisbane game on Friday evening, and not just to see how they line up with Tom Trbojevic and Jason Saab. It’s a matchup of two of the most expansive teams in the competition, who make a lot of shifts early in tackle counts and throw caution to the wind. One of these teams is 4-1 in their last five games, even with a slew of major injuries. The other is 2-2 with one draw and now faces a long stint without their star fullback and one of their strike wingers.
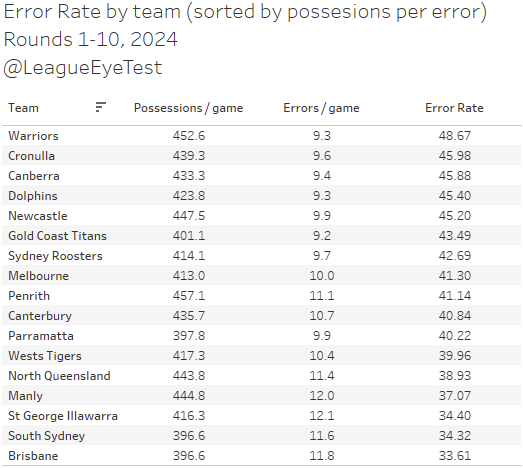
Playing wide has traditionally resulted in a higher error count. If you look at the number of errors both teams are making, the Broncos have the worst error rate (average number of possessions per error) in the NRL at one every 33.6 touches, with Manly fourth worst at one every 37 touches, according to Fox Sport Stats.
Not only do the Broncos have the worst error rate in the NRL, they also have the worst completion rate in the competition at 75%. Manly aren’t much better at 78%, but it is a meaningless number in isolation. As I’ve mentioned previously there’s a point where playing for completion rates results in safety first football and aim of reducing risks also reduces the number of try scoring opportunities. If you have Reece Walsh, why would you limit his effectiveness by making him more judicious when throwing the ball around?
Looking at where each teams play the balls are occurring by width, both Manly and Brisbane have at least 39% of their play the balls occurring outside of the middle third of the field.
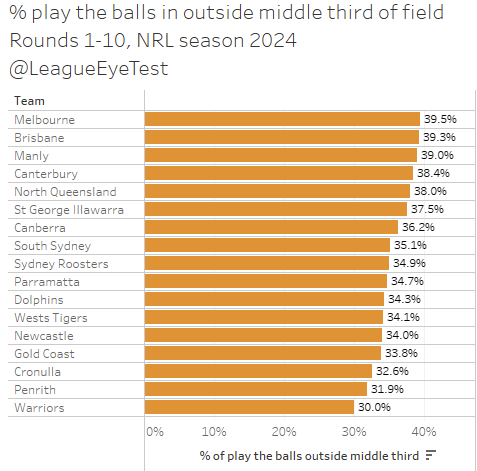
Both of those marks are a few percentage points above the same rate for last season, again indicating some wider shifts, especially early in tackle counts. This is something I’ve been tracking all season, and noted early that Manly and Brisbane were two of the best proponents of it.
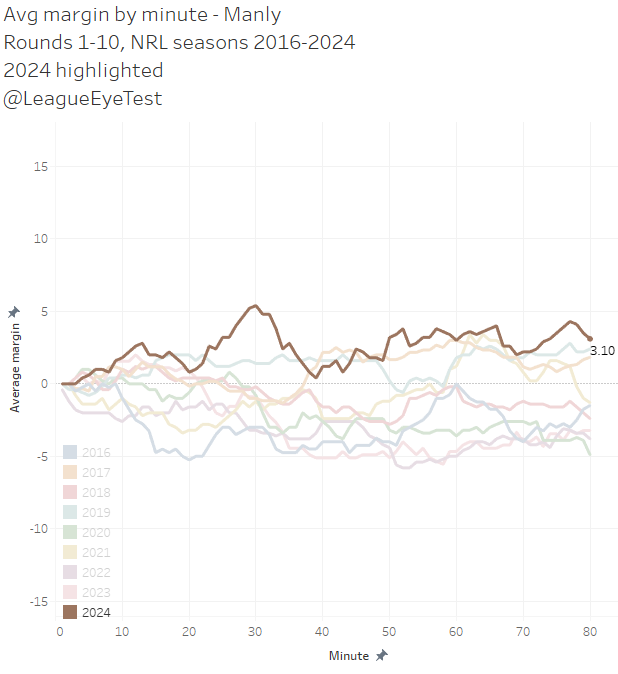
So why are Manly struggling lately whilst Brisbane is thriving? To start, let’s look at the average margin per minute for Manly this season, compared to prior seasons up to 10 rounds.
First the positives. Manly are the best side in the competition after 30 minutes, leading by an average of 5.4 points. As much as the margin fluctuates over the next 50 minutes, they still come out ahead by 3.1 points after 80 minutes.
Now the negatives. After being the best team in the competition after 30 minutes, by the 39th minute that average margin has shredded five full points, with Manly only ahead by 0.4 points on average after 40 minutes. From there on there’s some small fluctuations on the way to that +3.1 margin at full time, but no consistent increase or decrease. This would indicate they’re not pushing ahead when they’ve secured a lead, which if you’ve watched any Manly game this season would be painfully clear.
Let’s compare the above chart to Brisbane this season.
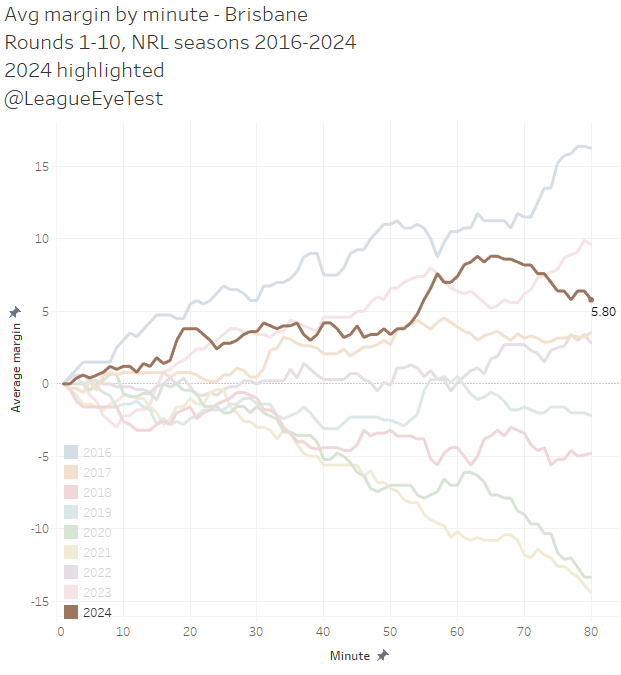
Here we can see a consistent trend moving towards the final margin. Additionally, the worrying sign for Manly is just how steep the gradient of the Broncos line becomes after the 52nd minute, where they go from 3.8 to 7.6 for their average margin. It’s an interesting contrast to Manly’s up and down margin in the second half.
It’s not just a second half issue for Manly, it’s reductive to frame it that way. We saw above that some of the problems happen leading up to the end of the first half. They’ve led well into the second half of most games, even if it’s by a small amount. It’s not as if they’re the Eels who as we noted on this very site two weeks ago, disappear in the final 30 minutes, as they did again against Brisbane.
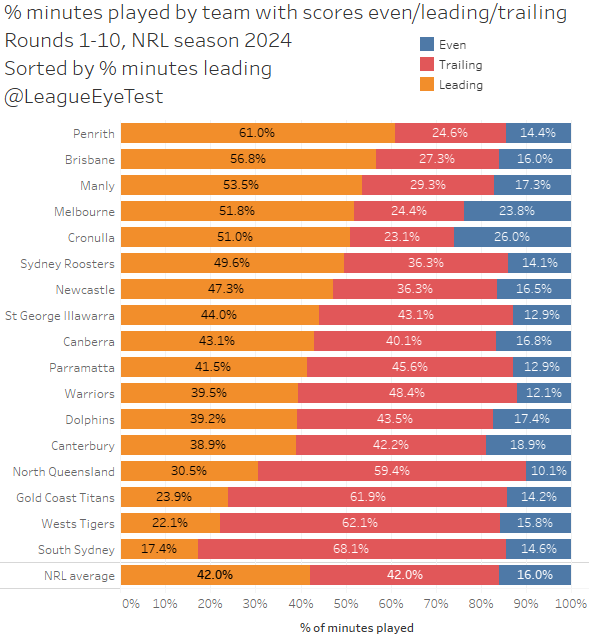
What we can see is that Manly are spending a significant proportion of their minutes leading on the scoreboard. They’ve played the third highest percentage of minutes this season when ahead at 53.5% of minutes, only trailing Penrith and Brisbane.
If you limit that to just second halves, they’re fourth behind the two teams mentioned above and the first placed Sharks. That’s elite company in terms of percentage of minutes led, but Manly aren’t seeing the same results as the others.
Breaking this down further into number of scores, this season, there’s been nothing the Sea Eagles like more than a close game.
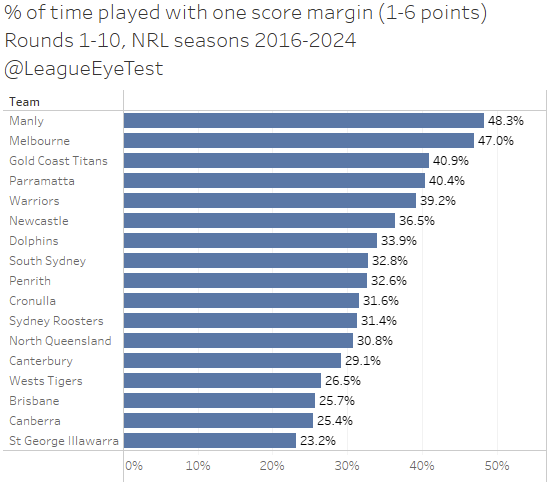
Over 48% of their minutes played have been with a margin of 1-6 points (one score), the highest in the NRL. That number drops dramatically though as the margins increase. When leading, they’re 4th with 29.8% of minutes when ahead by 7-12 points (two scores). They’re sixth in the NRL for percentage of minutes played with a three-score margin (13-18 points) at 15.2% of time leading.
But of minutes played by teams with a lead this season, just 1.3% of Manly’s minutes have come with a three score or more margin (18+ points), 16th in the NRL. The only reason they’re last is that South Sydney haven’t had a minute where they’ve led by more than two scores all season. It’s almost unbelievable that a team with as many attacking weapons and as much speed as Manly, hasn’t had more time leading by three converted tries or more.
Manly can put together a lead, they just can’t keep it this season. Which leads me to ask, why?
When you look at their position on the Eye Tests efficiency chart, which measures their expected points scored and conceded against on field points scored and conceded, we can start to unpack why this occurring. First up, let’s examine expected points gained per game against actual points scored per game.
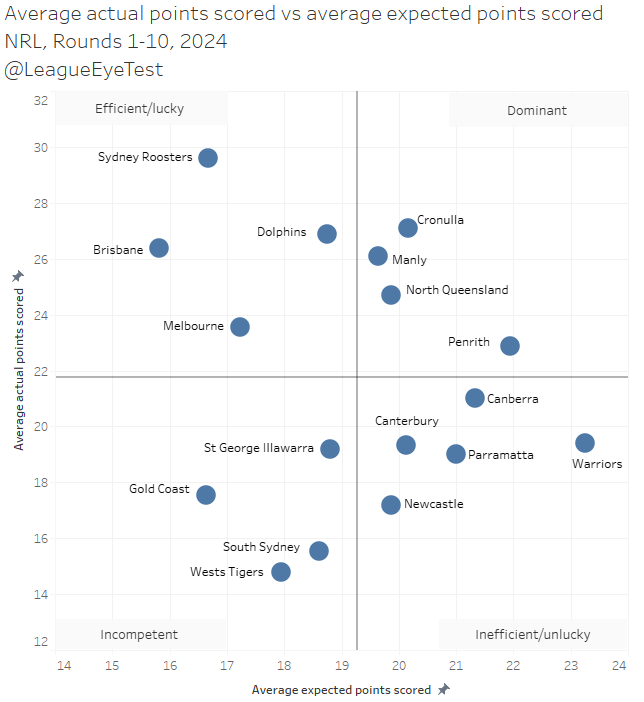
Manly here sit pretty well, in the dominant quadrant (above average expected points and above average actual points). They aren’t too far away from Cronulla here, who are leading the competition. They get high value expected point field position, and generally produce more points than that field position would yield for an average team.
When you compare them with Brisbane, we can see both teams are scoring the same number of points per game, around 26 per contest. However, Brisbane is doing with approximately four expected points per game fewer, implying that they’re far more efficient with their field position than Manly is. As much as the Sea Eagles aim for all out attack, they’re doing it more through brute force than being efficient like the Broncos or Roosters.
The bigger issue for Manly is where they sit defensively. The next chart shows average expected points per game conceded and average actual expected points per game conceded.
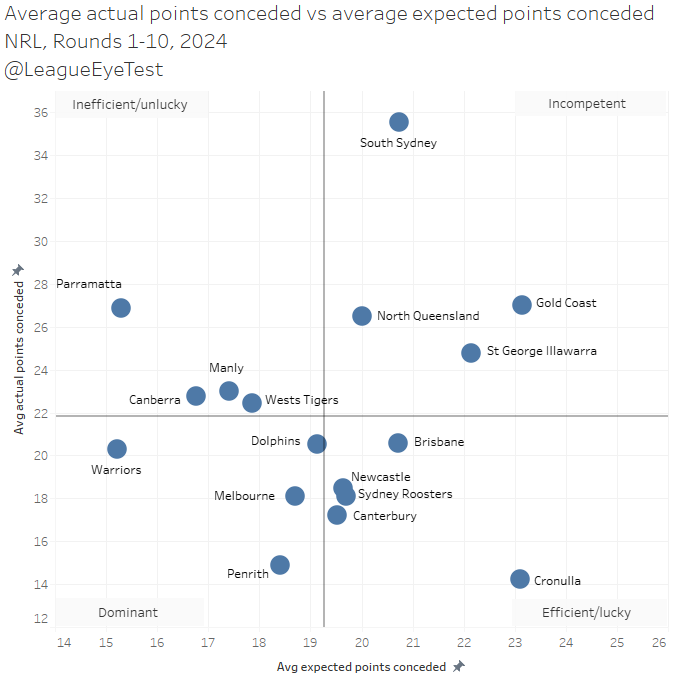
Manly are sitting in the inefficient quadrant, for teams who give up more than league average points per game but less than league average expected points per game. The positive side of this is that they’re very close to being in that dominant quadrant and give up the fourth fewest expected points per game. This indicates that Manly opponents don’t generate a lot of quality field position but are still able to score well. We’ll delve into this a bit more shortly.
This combination of dominant attack and inefficient defense has been a hallmark of Manly sides over the past few seasons. Here’s the same defensive chart above but just for Manly since 2016.
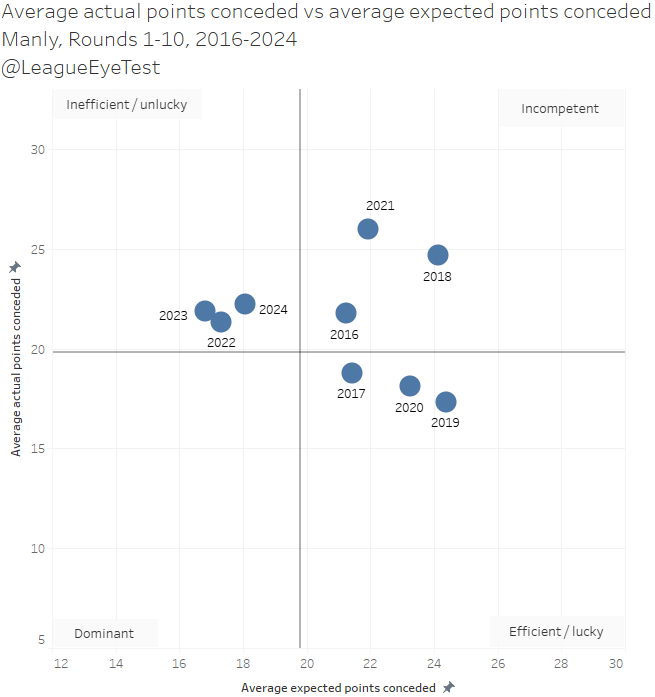
The last three seasons are almost sitting on top of each other, showing this style of defense has been part of their game since the end of Des Hasler’s reign and continued through Anthony Seibold’s tenure.
Again, this points to a style of play that looks tremendous when it works, but when the points aren’t flowing in attack, they’re susceptible to the late game flame outs we’ve seen lately. The impact of variance plays too heavily, especially defensively.
The individual expected point charts for their last two games show this. Both games resulted in Manly having better field position than their opponents for virtually the whole game.
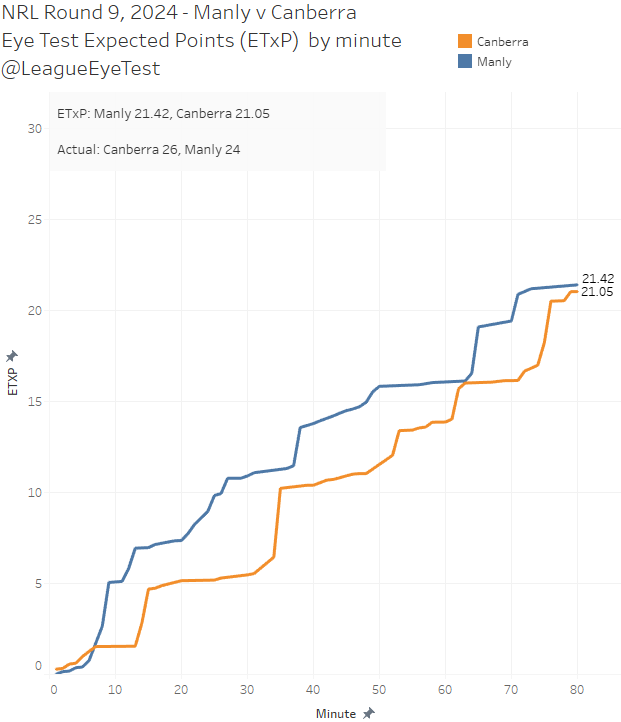
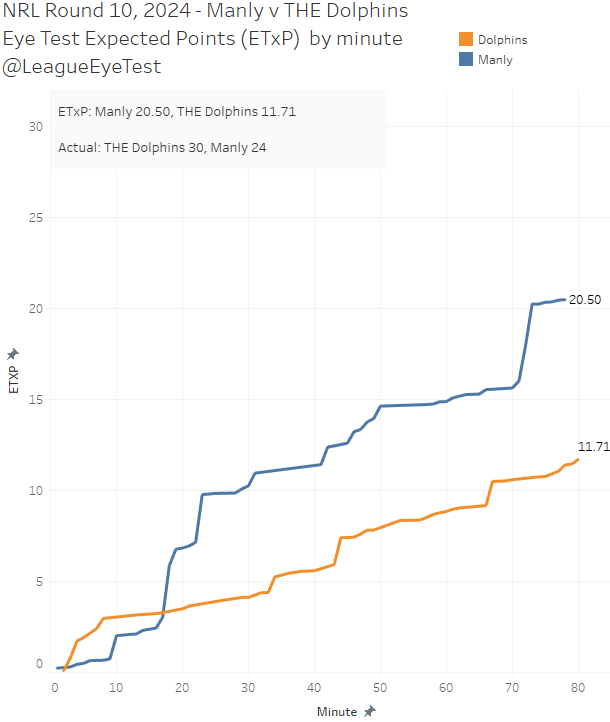
Yet in both games, they let both opponents back into the contest and in the case of the Dolphins, score significantly more points than their field position was worth.
That is part and parcel of their high risk/high reward style. Friend of the site and fellow NRL trainspotter Mike Meehall Wood has written about this previously, likening Manly’s style to Bazball.
Meehall Wood has also noted that they have the highest ratio of unassisted tries in the NRL. They rely more on individual efforts and capitalising on opponents’ errors to produce points than any other team in the competition. Given the composition of their team and the speed they possess, it makes sense to play towards that style.
Those are the sort of plays that when they pay off, they’re brilliant. We already saw what they could to Penrith in Round 5 when everything went their way. But the incidences of them occurring are very low, meaning they can’t be relied upon when holding a lead. It’s hard to build an attack around capitalising on opponent errors or mistakes if they’re not making them when you need them to.
The issue is that it’s extremely hard to switch that off when they need to. Meehall Wood noted it in his recap last week as well:
“Manly play some outstanding football at times, but their commitment to the bit is such that they aren’t playing game state enough.
I noted above their error rate being the highest in the competition. What’s interesting about their errors is not just that they make so many of them, but where they occur as not all errors are created equal.
Manly make the least amount of errors per game in their own half in the NRL. Which makes sense, conceding ball near your own try line is usually sub-optimal play.
But something happens when the Sea Eagles pass half way, when they become incredibly sloppy with the ball. They commit the most errors per game inside an opponents half, as if once they’re out of their own territory all bets are off and they’re in 100% attack mode. Which as we noted earlier when talking about completion rates, is going to lead to some tries out of nowhere.
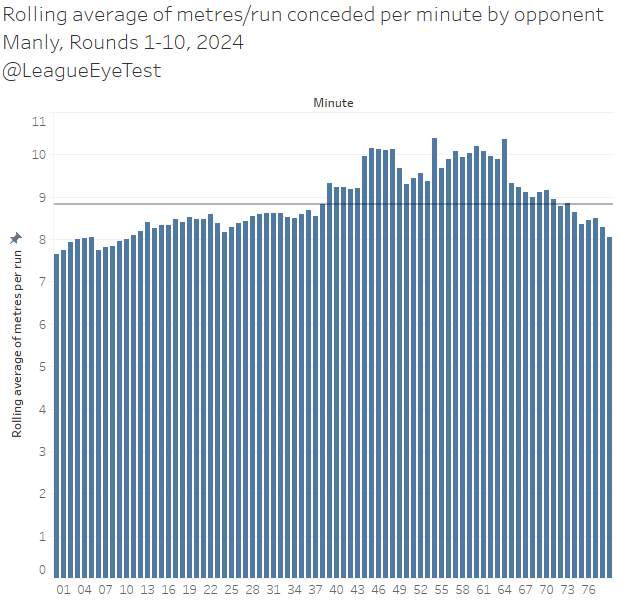
Their defense doesn’t help in the second half either, allowing more metres per run as the second half progresses. This was something we noted with the Eels in their second halves this season, allowing more metres as the game progresses, which doesn’t happen league wide as fatigue sets in.
Manly have a similar issue, with a few large spikes occuring right after half time when looking at a rolling average of metres conceded per run by minute.
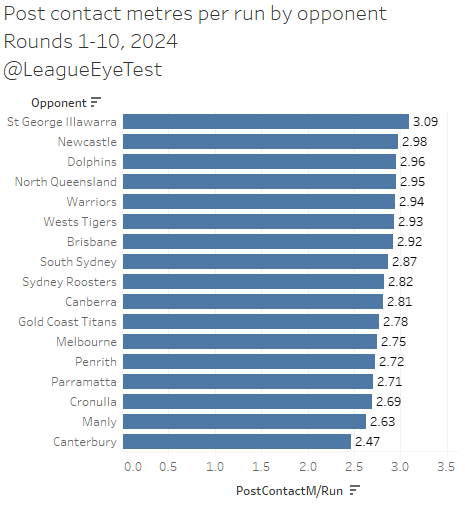
They also have a unique defensive profile as well. Their line speed is one of the worst in the league, giving up the fourth most pre-contact metres per run this season.
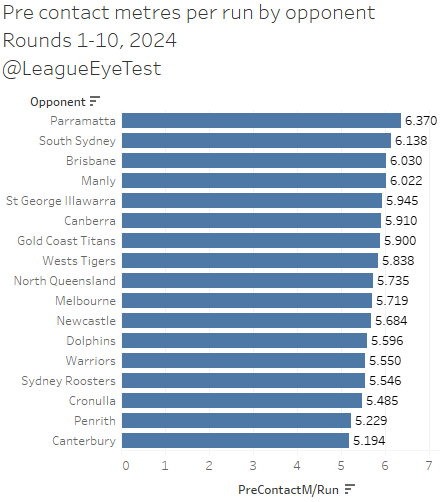
But they combat this by having the second best pre-contact metres per run allowed in the NRL, only trailing the defensively improved Canterbury Bulldogs.
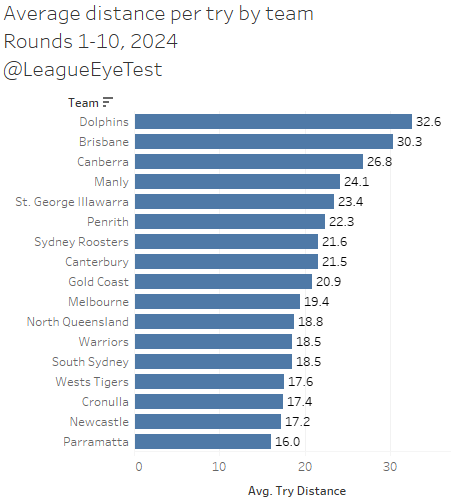
Unsurprisingly given their speed, the Sea Eagles have the fourth highest distance per try scored, scoring on average from about 24 metres away.
If we look at the the average distance per try scored this season by opponent though, there’s some evidence that Manly are switching off defensively at times or gambling on creating errors too often. Manly do have the most intercepts as a team this season in the NRL with 10, which may mean they’re playing to turnover the ball than defend the ball carrier.
The result of this is that they also concede the third highest metres per try in 2024, at 26 metres. That only trails the Eels and Tigers, which gives you an indication of how putrid that number is.
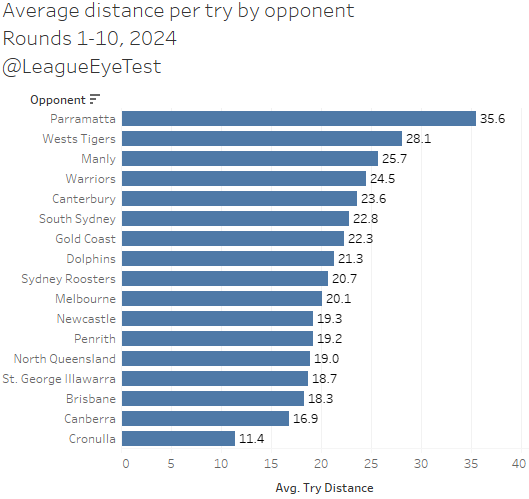
You’ll notice that the highest team in on that list is the Dolphins, something we noted last week. The Fins have scored the most tries from their own half in the NRL, which helps push up their average distance.
Yet even being aware it that ahead of time, the Sea Eagles let in them do it twice right before halftime, with both occurring around halfway. Here’s the play the ball that resulted in Trai Fuller’s try on Thursday evening.
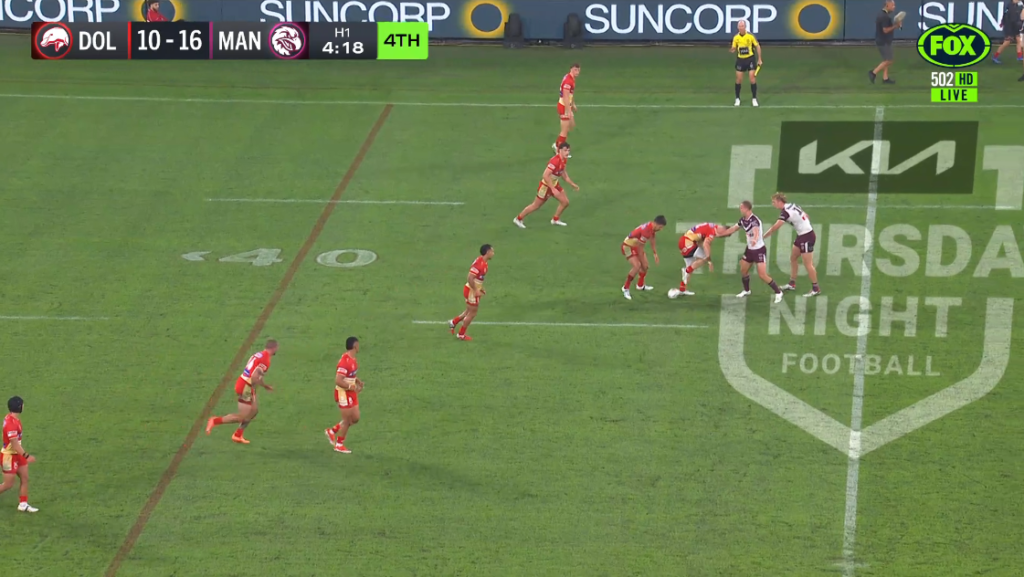
And here’s the play the ball that resulted in Mark Nicholls’ try a few minutes later.
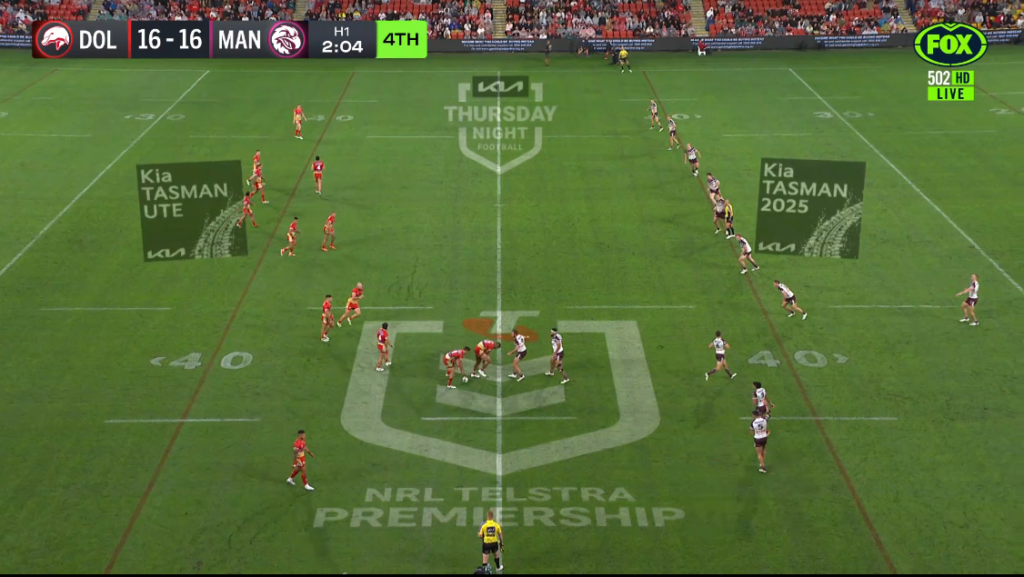
This was also after the try to Connelly Lemuelu in the 33rd minute, which started the Dolphins three try in five-minute blitz to turn a 16-4 deficit into a 20-6 half time lead.
Which brings us to one of the bigger issues with Manly. They might not commit errors in their own half, but they certainly concede tries from it.
The only team that concedes more tries from inside their own half than Manly is Parramatta, and no team concedes more tries between 50-20 metres out than the Sea Eagles. That number is astounding when you think that Manly have conceded 28 tries, and South Sydney have let 40 in, and both the Dragons and Sharks have allowed 32.
It’s not a lack of preparation, it looks more like sporadic lack of commitment, or in the case of playing for an intercept, over commitment. Defensive is mostly attitude and effort, which we noted from the Bulldogs deep dive earlier in the season, and at times Manly shows neither. The ease of which Fuller broke through their line, barely touched by Daly Cherry-Evans would be infuriating for Manly fans with the margin so tight.
Tying this into their issues holding a lead as a game progresses, Manly’s average try distance drops in the second half from 27.8 metres to just 19.3. Meaning their second half points need to come from closer to the opponents line, which they struggle to get to because they keep tuning the ball over. Their all out attacking style becomes less efficient as the game evolves.
Their opponents try distance does the opposite, it increases later in games. The average try conceded by Manly comes from 22 metres out in the first half, but nearly 31 metres in the second half.
Their discipline holds up in the second half as well. In fact, they’re awarded more penalties and set restarts combined than all but two teams in the competition.
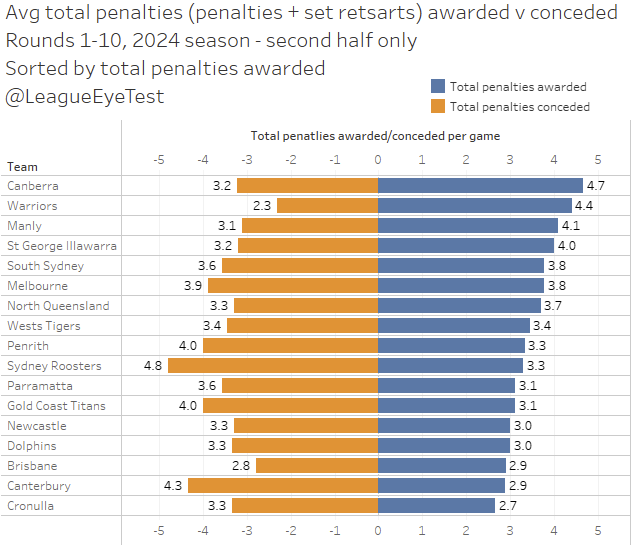
They also concede just 3.1 penalties and set restarts combined in the second half, one of the better marks in the competition.
Creating these long range tries and individual efforts will be even harder without Tom Trbjoevic and Jason Saab, who led the NRL in Run Metres Over Expected in 2023. They do have Haumole Olakau’atu who can create tries out of nowhere with individual efforts, but without the additional threats listed above, defenses will be able to focus on the Sea Eagles right edge even more.
It’s a perfect storm of issues that have created Manly’s inability to close out games this season. The early shifts and wide ball that works so well for them early in games becomes less successful as the match progresses. Their decision making when leading late in games also leaves a lot to be desired, a by product of playing a heavy attacking style and not being able to move to a conservative approach when needed. Their average distance per try also shrinks late in matches, needing to be closer to the line to produce points. Except they can’t get as close to the line as needed because they turn over the ball too often in opponent halves.
They also appear to switch off defensively, late in the first half and throughout the second. Their average margin plummets after 30 minutes, and opponents make more metres per run in the second half, during a period where most teams are making fewer metres per run as fatigue set in.
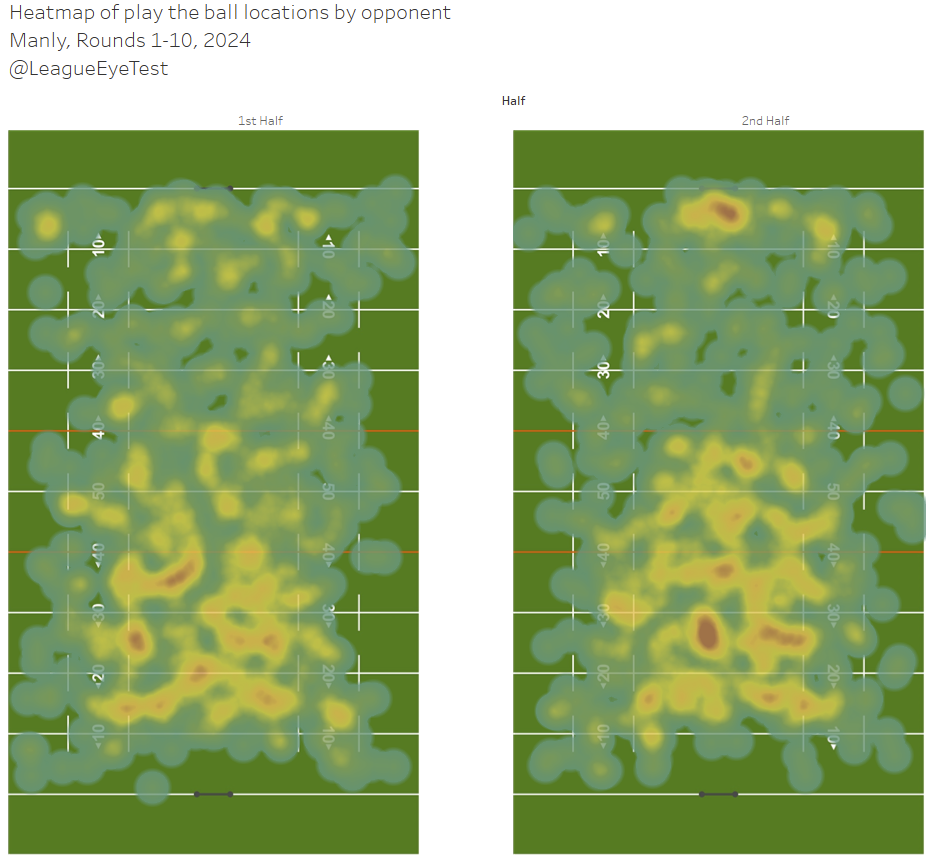
They allow tries from further out in the second half of games, which combined with their own need to be closer to score points makes field position even more of an issue. Their heat maps of opponent play the ball by half shows that they are giving up more field position around the posts in the second half. So not only are they allowing tries from further out, they’re also allowing teams to encroach on their try line more.
The positive signs for Seibold is that there is a framework here that can be (and is) successful when the team is healthy. But it’s heavily subject to variance, as not every big attacking play is going to pay off. When they don’t what do you fall back on? And if that is how you play 100% of the time, how do you adjust to protect a lead? There’s a reason teams that rely heavily on attack don’t usually succeed, unless they’re like the 2023 Brisbane Broncos who had some of the best goal line defense in the competition.
The good news for Manly is that they’re far close to the Broncos than the current poster children for 100% attack and 0% defense, unserious North Queensland Cowboys. If they can hover around the eighth position and secure a finals berth, a lucky day with the variance gods could see them knock off higher ranked foes in the finals.
Why can’t Manly maintain a lead? - The Rugby League Eye Test
There’s plenty of interesting match ups leading into Magic Round after the conclusion of NRL Round 10. The Sharks still have a firm grasp on first place and will be facing the hottest team in the competition Saturday evening. Canberra and Canterbury kick things off in the battle of two of the...
www.rugbyleagueeyetest.com
There’s plenty of interesting match ups leading into Magic Round after the conclusion of NRL Round 10.
There’s the Sharks holding on to first place and facing the hottest team in the competition Saturday evening. Canberra and Canterbury kick things off in the battle of two of the big overachievers. The Warriors woes continue against Penrith on Sunday afternoon, looking broken and tired and desperately needing a week off. The Cowboys will face the only team in the competition that’s worse than them defensively.
But this week I’m most interested in the Manly and Brisbane game on Friday evening, and not just to see how they line up with Tom Trbojevic and Jason Saab. It’s a matchup of two of the most expansive teams in the competition, who make a lot of shifts early in tackle counts and throw caution to the wind. One of these teams is 4-1 in their last five games, even with a slew of major injuries. The other is 2-2 with one draw and now faces a long stint without their star fullback and one of their strike wingers.
Playing wide has traditionally resulted in a higher error count. If you look at the number of errors both teams are making, the Broncos have the worst error rate (average number of possessions per error) in the NRL at one every 33.6 touches, with Manly fourth worst at one every 37 touches, according to Fox Sport Stats.
Not only do the Broncos have the worst error rate in the NRL, they also have the worst completion rate in the competition at 75%. Manly aren’t much better at 78%, but it is a meaningless number in isolation. As I’ve mentioned previously there’s a point where playing for completion rates results in safety first football and aim of reducing risks also reduces the number of try scoring opportunities. If you have Reece Walsh, why would you limit his effectiveness by making him more judicious when throwing the ball around?
Looking at where each teams play the balls are occurring by width, both Manly and Brisbane have at least 39% of their play the balls occurring outside of the middle third of the field.
Both of those marks are a few percentage points above the same rate for last season, again indicating some wider shifts, especially early in tackle counts. This is something I’ve been tracking all season, and noted early that Manly and Brisbane were two of the best proponents of it.
So why are Manly struggling lately whilst Brisbane is thriving? To start, let’s look at the average margin per minute for Manly this season, compared to prior seasons up to 10 rounds.
First the positives. Manly are the best side in the competition after 30 minutes, leading by an average of 5.4 points. As much as the margin fluctuates over the next 50 minutes, they still come out ahead by 3.1 points after 80 minutes.
Now the negatives. After being the best team in the competition after 30 minutes, by the 39th minute that average margin has shredded five full points, with Manly only ahead by 0.4 points on average after 40 minutes. From there on there’s some small fluctuations on the way to that +3.1 margin at full time, but no consistent increase or decrease. This would indicate they’re not pushing ahead when they’ve secured a lead, which if you’ve watched any Manly game this season would be painfully clear.
Let’s compare the above chart to Brisbane this season.
Here we can see a consistent trend moving towards the final margin. Additionally, the worrying sign for Manly is just how steep the gradient of the Broncos line becomes after the 52nd minute, where they go from 3.8 to 7.6 for their average margin. It’s an interesting contrast to Manly’s up and down margin in the second half.
It’s not just a second half issue for Manly, it’s reductive to frame it that way. We saw above that some of the problems happen leading up to the end of the first half. They’ve led well into the second half of most games, even if it’s by a small amount. It’s not as if they’re the Eels who as we noted on this very site two weeks ago, disappear in the final 30 minutes, as they did again against Brisbane.
What we can see is that Manly are spending a significant proportion of their minutes leading on the scoreboard. They’ve played the third highest percentage of minutes this season when ahead at 53.5% of minutes, only trailing Penrith and Brisbane.
If you limit that to just second halves, they’re fourth behind the two teams mentioned above and the first placed Sharks. That’s elite company in terms of percentage of minutes led, but Manly aren’t seeing the same results as the others.
Breaking this down further into number of scores, this season, there’s been nothing the Sea Eagles like more than a close game.
Over 48% of their minutes played have been with a margin of 1-6 points (one score), the highest in the NRL. That number drops dramatically though as the margins increase. When leading, they’re 4th with 29.8% of minutes when ahead by 7-12 points (two scores). They’re sixth in the NRL for percentage of minutes played with a three-score margin (13-18 points) at 15.2% of time leading.
But of minutes played by teams with a lead this season, just 1.3% of Manly’s minutes have come with a three score or more margin (18+ points), 16th in the NRL. The only reason they’re last is that South Sydney haven’t had a minute where they’ve led by more than two scores all season. It’s almost unbelievable that a team with as many attacking weapons and as much speed as Manly, hasn’t had more time leading by three converted tries or more.
Manly can put together a lead, they just can’t keep it this season. Which leads me to ask, why?
When you look at their position on the Eye Tests efficiency chart, which measures their expected points scored and conceded against on field points scored and conceded, we can start to unpack why this occurring. First up, let’s examine expected points gained per game against actual points scored per game.
Manly here sit pretty well, in the dominant quadrant (above average expected points and above average actual points). They aren’t too far away from Cronulla here, who are leading the competition. They get high value expected point field position, and generally produce more points than that field position would yield for an average team.
When you compare them with Brisbane, we can see both teams are scoring the same number of points per game, around 26 per contest. However, Brisbane is doing with approximately four expected points per game fewer, implying that they’re far more efficient with their field position than Manly is. As much as the Sea Eagles aim for all out attack, they’re doing it more through brute force than being efficient like the Broncos or Roosters.
The bigger issue for Manly is where they sit defensively. The next chart shows average expected points per game conceded and average actual expected points per game conceded.
Manly are sitting in the inefficient quadrant, for teams who give up more than league average points per game but less than league average expected points per game. The positive side of this is that they’re very close to being in that dominant quadrant and give up the fourth fewest expected points per game. This indicates that Manly opponents don’t generate a lot of quality field position but are still able to score well. We’ll delve into this a bit more shortly.
This combination of dominant attack and inefficient defense has been a hallmark of Manly sides over the past few seasons. Here’s the same defensive chart above but just for Manly since 2016.
The last three seasons are almost sitting on top of each other, showing this style of defense has been part of their game since the end of Des Hasler’s reign and continued through Anthony Seibold’s tenure.
Again, this points to a style of play that looks tremendous when it works, but when the points aren’t flowing in attack, they’re susceptible to the late game flame outs we’ve seen lately. The impact of variance plays too heavily, especially defensively.
The individual expected point charts for their last two games show this. Both games resulted in Manly having better field position than their opponents for virtually the whole game.
Yet in both games, they let both opponents back into the contest and in the case of the Dolphins, score significantly more points than their field position was worth.
That is part and parcel of their high risk/high reward style. Friend of the site and fellow NRL trainspotter Mike Meehall Wood has written about this previously, likening Manly’s style to Bazball.
Meehall Wood has also noted that they have the highest ratio of unassisted tries in the NRL. They rely more on individual efforts and capitalising on opponents’ errors to produce points than any other team in the competition. Given the composition of their team and the speed they possess, it makes sense to play towards that style.
Those are the sort of plays that when they pay off, they’re brilliant. We already saw what they could to Penrith in Round 5 when everything went their way. But the incidences of them occurring are very low, meaning they can’t be relied upon when holding a lead. It’s hard to build an attack around capitalising on opponent errors or mistakes if they’re not making them when you need them to.
The issue is that it’s extremely hard to switch that off when they need to. Meehall Wood noted it in his recap last week as well:
“Manly play some outstanding football at times, but their commitment to the bit is such that they aren’t playing game state enough.
I noted above their error rate being the highest in the competition. What’s interesting about their errors is not just that they make so many of them, but where they occur as not all errors are created equal.
Manly make the least amount of errors per game in their own half in the NRL. Which makes sense, conceding ball near your own try line is usually sub-optimal play.
But something happens when the Sea Eagles pass half way, when they become incredibly sloppy with the ball. They commit the most errors per game inside an opponents half, as if once they’re out of their own territory all bets are off and they’re in 100% attack mode. Which as we noted earlier when talking about completion rates, is going to lead to some tries out of nowhere.
Their defense doesn’t help in the second half either, allowing more metres per run as the second half progresses. This was something we noted with the Eels in their second halves this season, allowing more metres as the game progresses, which doesn’t happen league wide as fatigue sets in.
Manly have a similar issue, with a few large spikes occuring right after half time when looking at a rolling average of metres conceded per run by minute.
They also have a unique defensive profile as well. Their line speed is one of the worst in the league, giving up the fourth most pre-contact metres per run this season.
But they combat this by having the second best pre-contact metres per run allowed in the NRL, only trailing the defensively improved Canterbury Bulldogs.
Unsurprisingly given their speed, the Sea Eagles have the fourth highest distance per try scored, scoring on average from about 24 metres away.
If we look at the the average distance per try scored this season by opponent though, there’s some evidence that Manly are switching off defensively at times or gambling on creating errors too often. Manly do have the most intercepts as a team this season in the NRL with 10, which may mean they’re playing to turnover the ball than defend the ball carrier.
The result of this is that they also concede the third highest metres per try in 2024, at 26 metres. That only trails the Eels and Tigers, which gives you an indication of how putrid that number is.
You’ll notice that the highest team in on that list is the Dolphins, something we noted last week. The Fins have scored the most tries from their own half in the NRL, which helps push up their average distance.
Yet even being aware it that ahead of time, the Sea Eagles let in them do it twice right before halftime, with both occurring around halfway. Here’s the play the ball that resulted in Trai Fuller’s try on Thursday evening.
And here’s the play the ball that resulted in Mark Nicholls’ try a few minutes later.
This was also after the try to Connelly Lemuelu in the 33rd minute, which started the Dolphins three try in five-minute blitz to turn a 16-4 deficit into a 20-6 half time lead.
Which brings us to one of the bigger issues with Manly. They might not commit errors in their own half, but they certainly concede tries from it.
The only team that concedes more tries from inside their own half than Manly is Parramatta, and no team concedes more tries between 50-20 metres out than the Sea Eagles. That number is astounding when you think that Manly have conceded 28 tries, and South Sydney have let 40 in, and both the Dragons and Sharks have allowed 32.
It’s not a lack of preparation, it looks more like sporadic lack of commitment, or in the case of playing for an intercept, over commitment. Defensive is mostly attitude and effort, which we noted from the Bulldogs deep dive earlier in the season, and at times Manly shows neither. The ease of which Fuller broke through their line, barely touched by Daly Cherry-Evans would be infuriating for Manly fans with the margin so tight.
Tying this into their issues holding a lead as a game progresses, Manly’s average try distance drops in the second half from 27.8 metres to just 19.3. Meaning their second half points need to come from closer to the opponents line, which they struggle to get to because they keep tuning the ball over. Their all out attacking style becomes less efficient as the game evolves.
Their opponents try distance does the opposite, it increases later in games. The average try conceded by Manly comes from 22 metres out in the first half, but nearly 31 metres in the second half.
Their discipline holds up in the second half as well. In fact, they’re awarded more penalties and set restarts combined than all but two teams in the competition.
They also concede just 3.1 penalties and set restarts combined in the second half, one of the better marks in the competition.
Creating these long range tries and individual efforts will be even harder without Tom Trbjoevic and Jason Saab, who led the NRL in Run Metres Over Expected in 2023. They do have Haumole Olakau’atu who can create tries out of nowhere with individual efforts, but without the additional threats listed above, defenses will be able to focus on the Sea Eagles right edge even more.
It’s a perfect storm of issues that have created Manly’s inability to close out games this season. The early shifts and wide ball that works so well for them early in games becomes less successful as the match progresses. Their decision making when leading late in games also leaves a lot to be desired, a by product of playing a heavy attacking style and not being able to move to a conservative approach when needed. Their average distance per try also shrinks late in matches, needing to be closer to the line to produce points. Except they can’t get as close to the line as needed because they turn over the ball too often in opponent halves.
They also appear to switch off defensively, late in the first half and throughout the second. Their average margin plummets after 30 minutes, and opponents make more metres per run in the second half, during a period where most teams are making fewer metres per run as fatigue set in.
They allow tries from further out in the second half of games, which combined with their own need to be closer to score points makes field position even more of an issue. Their heat maps of opponent play the ball by half shows that they are giving up more field position around the posts in the second half. So not only are they allowing tries from further out, they’re also allowing teams to encroach on their try line more.
The positive signs for Seibold is that there is a framework here that can be (and is) successful when the team is healthy. But it’s heavily subject to variance, as not every big attacking play is going to pay off. When they don’t what do you fall back on? And if that is how you play 100% of the time, how do you adjust to protect a lead? There’s a reason teams that rely heavily on attack don’t usually succeed, unless they’re like the 2023 Brisbane Broncos who had some of the best goal line defense in the competition.
The good news for Manly is that they’re far close to the Broncos than the current poster children for 100% attack and 0% defense, unserious North Queensland Cowboys. If they can hover around the eighth position and secure a finals berth, a lucky day with the variance gods could see them knock off higher ranked foes in the finals.
Last edited:
")